Basketball Player Analysis: Exploring the Data
Exploratory Data Analysis
Introduction
Basketball is not just a sport; it’s a dynamic, fast-paced game that involves skill, strategy, and teamwork. In this analysis, we delve into the world of basketball player statistics, exploring a dataset on the Atlanta Hawks professional basketball team that combines information on player demographics, performance metrics, and shooting preferences. The dataset contains nearly six hundred players since that have played on the Hawks since the early 1950’s.
Motivation and Research Questions
Understanding player statistics is crucial for teams, coaches, and fans alike. How has shooting and efficiency changed over the years? How do shooting preferences vary among different positions? We aim to answer these questions and gain insights into the dynamics of basketball player performance.
Questions for Exploration:
- How has the distribution of player positions evolved over the years?
- Are there correlations between shooting percentages and points per game?
- How do shooting preferences vary across different player positions?
- What trends can we observe in free throw percentages for specific positions?
Data Collection and Cleaning
To conduct this analysis, we collected data from Basketball Reference, focusing on the Atlanta Hawks team. We merged two datasets, one containing player data and another detailing player positions and shooting preferences. After cleaning and merging the data, we created a comprehensive dataset for exploration. If you want to check out my blog post on the data collection, you can check that out here!
Exploratory Data Analysis (EDA)
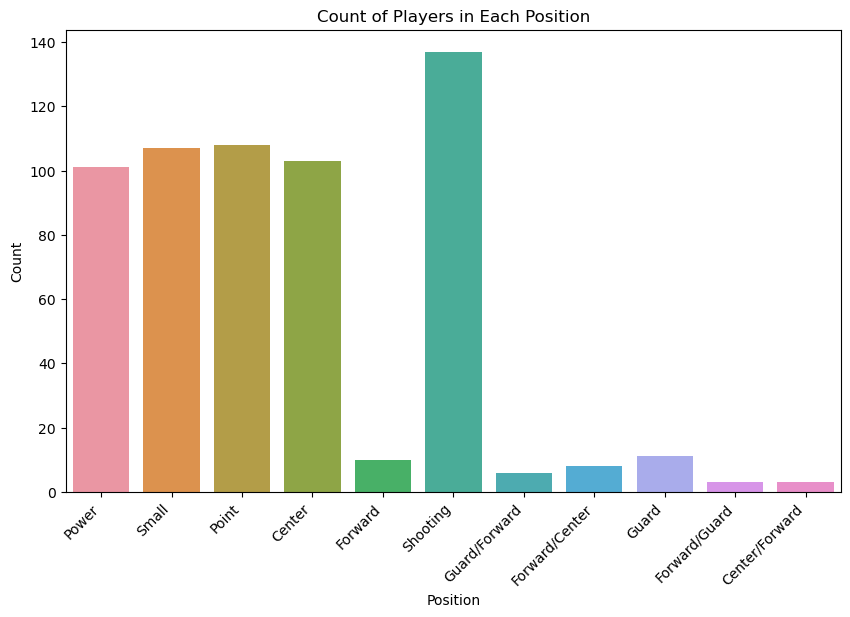
Count of Players in Each Position
The bar chart meticulously breaks down the distribution of players across different positions in the Atlanta Hawks team. This snapshot not only offers a glimpse into the current team composition but also serves as a historical lens, enabling us to trace the evolution of player positions over the years. Exploring changes in player distribution can provide context to shifts in team strategy and dynamics.

Distribution of Players’ Shooting Preferences
The pie chart serves as a visual feast, dissecting the intricate landscape of players’ shooting preferences. Knowing the prevalence of right and left-handed shooters is more than a mere curiosity; it unravels a layer of strategy. Understanding the predominant shooting hand within the team contributes to a nuanced comprehension of offensive plays and defensive strategies employed by opponents.

Distribution of Players’ Shooting Percentages by Position
The box plot steps into the realm of shooting percentages, offering a rich tapestry of insights into player performance. Each position becomes a character in the narrative, with the plot unveiling variations in shooting efficiency. This exploration is crucial for coaches and analysts, providing a visual guide to identify positions of strength and areas that may require strategic refinement.

Trends in Shooting Percentages Over the Years by Position
The line plot extends our exploration into historical perspectives by tracking shooting trends over the years. Each line on the plot narrates a story of shooting efficiency, allowing us to observe the ebb and flow of player performance across different positions. Uncovering trends provides a foundation for understanding the factors influencing shooting percentages, be it changes in player composition, coaching strategies, or league-wide trends.

Distribution of Players’ Points Per Game by Position
The violin plot takes us into the realm of offensive prowess, examining the distribution of points per game for selected positions. Beyond raw shooting percentages, this plot delves into the impact of players on the scoreboard. The varying widths of the violins offer insights into the consistency and variability of offensive contributions from different positions.

Average Free Throw Percentage by Position
The bar chart becomes a compass guiding us through the landscape of free throw performance. Highlighting the average free throw percentage for specific positions, this plot offers a deeper understanding of player capabilities in crucial game moments. Variations in free throw performance could be indicative of individual skills and the ability to maintain composure under pressure.

In conclusion, our journey through this comprehensive EDA has provided a panoramic view of Atlanta Hawks player statistics. Beyond the numbers, we’ve uncovered the nuances that define the team’s dynamics. As basketball enthusiasts explore these visualizations, they are invited to not only draw conclusions but to be active contributors to the ongoing narrative of the game told through the language of data. The complete code and dataset beckon exploration and collaboration, ensuring that the story of basketball continues to evolve.
Conclusion
Our journey into Atlanta Hawks player statistics has provided valuable insights into the team’s dynamics. From player positions to shooting preferences, we’ve gained a deeper understanding of the factors influencing the team’s performance. As we conclude this analysis, we invite fellow basketball enthusiasts to explore the data and draw their own conclusions. The full code and dataset are available here, encouraging collaboration and further exploration.
Basketball is more than just a game – it’s a story told through data.